Nov 2026
Recording every new token forward, pre-registering every rule, and a real-money post-mortem that blamed the safety stops, not the strategy.
Quant, Research, Crypto, Python, Next.js
New to some of the terms? See the glossary at the end.
In August I switched on a paper-trading bot that held US stocks according to ten signals. Each one had passed every test my research lab could throw at it, and one of them had just done the rarest thing in this whole project: it scored exactly the same on sealed, never-seen data as it had in its backtest. I was pleased with myself.
Then I asked the question I should have asked first. What would the same tests say about doing nothing at all, just buying the market and holding it?
It passed every test that could be scored. And over the three and a half years of sealed data, simply holding the market made more money than all ten of my signals.
This post is about that: how a careful testing process can approve a strategy that is mostly a more expensive way of owning an index fund, and the one signal that might be more than that. It follows on from my earlier post on 56 trading hypotheses, which ended with these signals as the only survivors.
A regime timer is the simplest kind of market-timing rule. It owns the stock market most of the time, and steps aside into cash when some gauge says conditions look dangerous. It never bets on the market falling, only on whether to be in it.
The ten that survived each watched a different gauge:
Every rule was written down before it was tested, with no tuning afterwards. They trade SPY and QQQ (the S&P 500 and Nasdaq-100), scaled to a steady 10% a year of risk, after trading costs. The bot I deployed held an equal blend of all ten.
Each signal went through the same five tests, on 2007–2022 data. A strategy was built on four years and tested on the next one, rolling forward a year at a time, so the twelve test years from 2011 to 2022 were all data it hadn’t seen. To pass, it needed a Sharpe ratio of at least 0.5 over those years, with a worst drawdown under 25%; an edge that survived doubled trading costs; stable results when its settings were nudged; consistency across different kinds of market; and a passing deflated Sharpe ratio, which corrects for how many ideas were tried. The ten timers scored Sharpe ratios between 0.59 and 0.80.
Here is what the same tests say about buy-and-hold, run through exactly the same code:
| Test | Requirement | Buy-and-hold |
|---|---|---|
| Walk-forward Sharpe, 2011–2022 | at least 0.5 | 0.75: passes |
| Walk-forward efficiency | at least 0.5 | 0.94: passes |
| Worst drawdown | under 25% | 14.5%: passes |
| Cost stress, 2× costs | keeps half its Sharpe | 0.74: passes |
| Settings nudged | stays stable | no settings to nudge |
| Regime consistency | predicts returns in 2 of 4 market types | can’t be measured |
| Deflated Sharpe ratio | probability at least 0.90 | 1.00: passes |
The only test buy-and-hold fails is the one that measures whether a signal predicts returns. A signal that never changes predicts nothing, so the test can’t score it. It doesn’t fail on performance; it fails on a technicality.
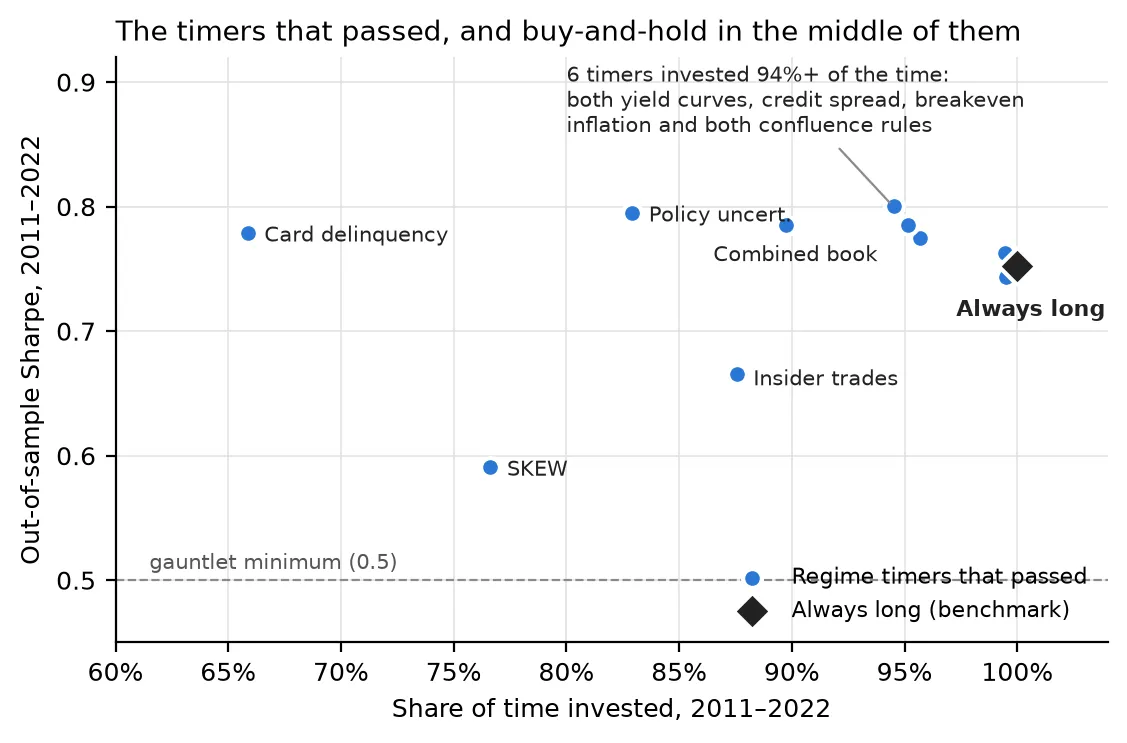
Each blue dot is a timer that passed. The black diamond is buy-and-hold.
The chart shows why. Plot each timer’s Sharpe ratio against how much of the time it was actually invested, and buy-and-hold sits right in the middle of them. Six of the ten were invested 94% of the time or more in 2011–2022; the majority vote was invested 99.9% of days. Through the very years they were selected on, most of them simply were buy-and-hold, with an occasional step aside that roughly broke even. My tests asked “does this make money?” when the question that mattered was “does this make more than owning the market?”.
The sealed data, my lockbox, covers January 2023 to August 2026. That’s 905 trading days no signal was built or tested on. Opening it was meant to be the final exam.
The yield-curve timer’s result looked like the best outcome in the lab’s history. Its Sharpe ratio on the sealed data was 0.77. In the backtest it was 0.77. Almost nothing replicates that cleanly.
But the curve was inverted when the lockbox opened, so the timer sat in cash for the first 20 months, from January 2023 to late August 2024, straight through a strong rally. It made 5.9% a year. Buy-and-hold, with the same risk scaling and costs, made 14.6%.
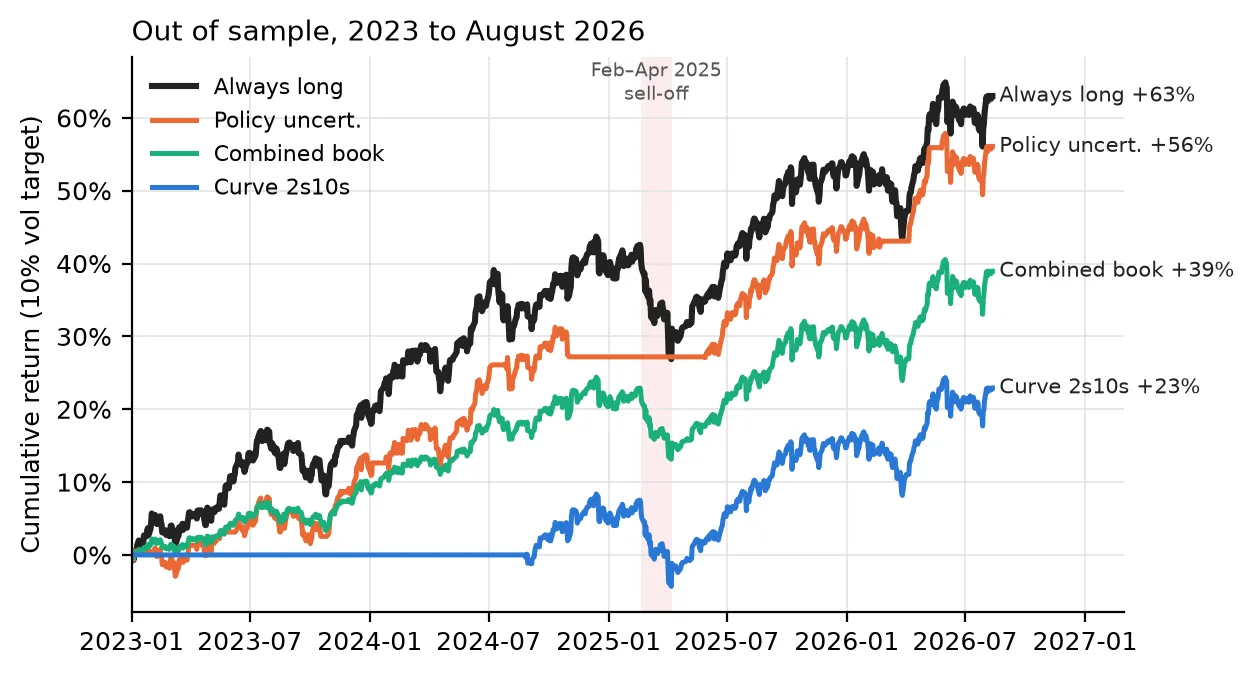
Growth over the sealed period for buy-and-hold, the combined book I deployed, and the two timers discussed here.
The replication was real: the signal did exactly what it had always done. What it had always done just wasn’t worth much compared with staying invested. Here are all of them over the same period:
| Signal | Sharpe | Return a year | Worst drawdown | Time invested |
|---|---|---|---|---|
| Always long (benchmark) | 1.35 | 14.6% | 11.7% | 100% |
| Economic policy uncertainty | 1.51 | 13.2% | 5.9% | 72% |
| Insider buying and selling | 1.37 | 13.6% | 11.8% | 84% |
| Majority vote of five | 1.35 | 14.4% | 11.7% | 98% |
| Credit spread | 1.33 | 13.5% | 8.2% | 92% |
| Breakeven inflation | 1.27 | 12.9% | 11.3% | 88% |
| Combined book (what I deployed) | 1.22 | 9.6% | 9.1% | 70% |
| CBOE SKEW index | 1.04 | 9.4% | 10.0% | 72% |
| Yield curve inversion (2s10s) | 0.77 | 5.9% | 11.7% | 54% |
| Curve AND credit (both must agree) | 0.74 | 5.2% | 8.2% | 47% |
| Credit card delinquency | 0.68 | 5.2% | 11.7% | 54% |
| Yield curve inversion (3m10y) | 0.49 | 2.9% | 7.5% | 36% |
Every one of them made less money than buy-and-hold. Only policy uncertainty clearly beat it on Sharpe ratio; insider trading edged it (1.37 against 1.35) and the majority vote tied it. The book I actually deployed, the equal blend of all ten, gave up a third of the return to shave a few points off the worst drawdown: a cautious index fund, not an edge.
There was one real test in the sealed period. From 19 February to 8 April 2025, around the US tariff announcements, SPY fell 19% and QQQ 23%. Timers exist for moments like that. Who stepped aside?
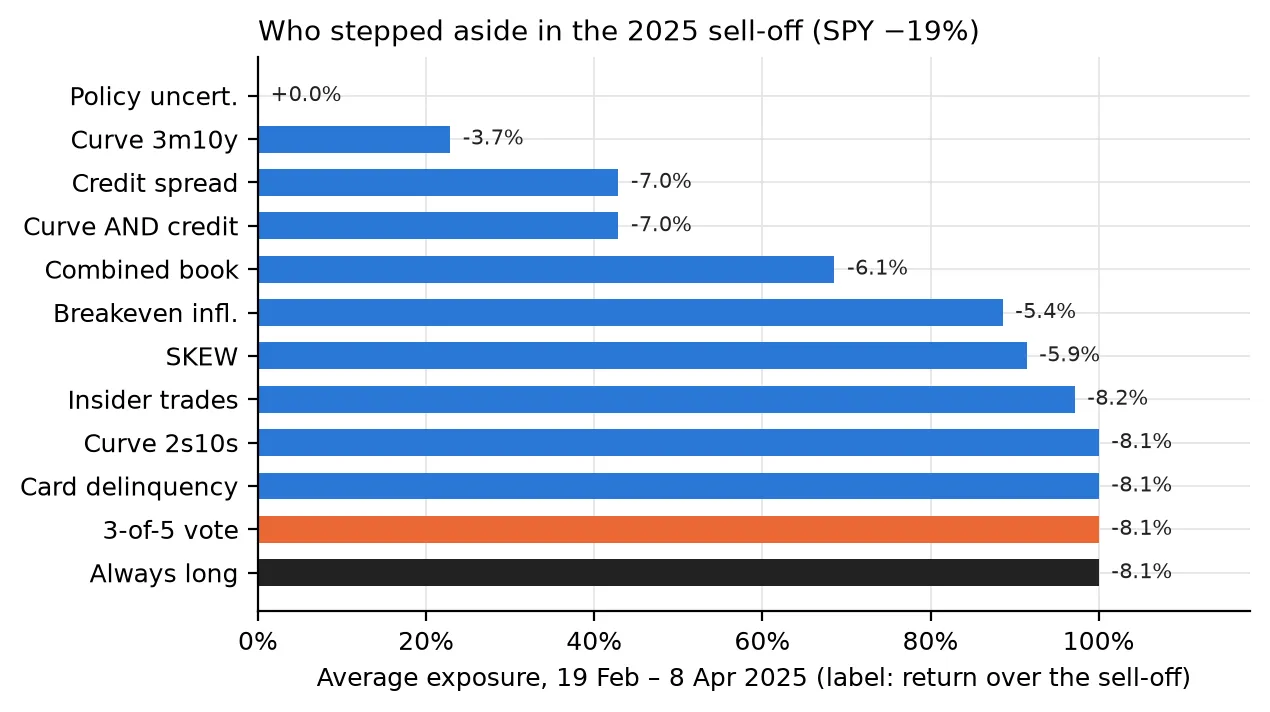
Average exposure over the sell-off, and each strategy’s return over it; the majority vote is in orange. Buy-and-hold lost 8.1% rather than 19% because the volatility scaling cut its position as markets got rougher.
Most of them didn’t. The yield curve, card delinquencies and insider timers were fully or almost fully invested throughout. The credit-spread timer did get out, but only on 19 March, a month into the fall, and it stayed out until 4 June, missing much of the rebound.
The majority vote is the most instructive failure. It stayed fully invested the whole way down, even though two of its five gauges were pointing out on most days, mainly policy uncertainty and credit spreads. The rule needed three of five to agree. On 24 of the 35 trading days of the sell-off, exactly two did, and never three. I had built the vote to be robust to any one gauge being wrong. In practice that meant it ignored two gauges that were right.
The policy-uncertainty timer is the only result I’d call interesting. It had the best Sharpe ratio on the sealed data (1.51 against 1.35), half the worst drawdown (5.9% against 11.7%), and it was entirely out of the market for the 2025 sell-off, losing nothing while buy-and-hold lost 8.1%.
Two things keep me from getting excited. First, it stepped aside on 4 November 2024, the day before the US election, and stayed out for 140 trading days, until late May 2025. That avoided the crash, but it also skipped the post-election rally, which is why it still made less money overall than buy-and-hold (13.2% a year against 14.6%). Second, and more important, the 2025 sell-off was a policy shock almost by definition: tariffs announced, escalated and then paused by executive order. A gauge that counts newspaper stories about policy uncertainty was always going to light up. One event that matches what a signal measures is a good story, not evidence. It needs a different kind of stress before it means much.
There is one more correction I hadn’t applied properly. Every timer was marked “robust” partly because of its deflated Sharpe ratio, which asks how likely a result is to be luck given how many ideas were tried. But I counted the tries within each family of related ideas: the credit-spread timer was the first credit-spread timer, so it was judged as one attempt.
Across the whole lab, by the time each was tested, between 78 and 143 ideas had been run. Deflated against that number, every one of the ten timers, and the combined book, scores a probability of 0.0002 or less: effectively zero. Their Sharpe ratios of 0.6–0.8 are about what you’d expect the best of a hundred-odd tries to show by chance, especially when most of them are just owning the market. A review of an earlier signal had flagged this exact mistake, and I repeated it here, one family at a time.
As research, the honest result is that ten “robust” market timers turned out to be one interesting lead and nine expensive index funds. The paper-trading bot is useful as a test of the trading machinery, not as evidence for the signals.
The research itself ran from 13 to 19 August 2026. For this post, in October, I reran everything from scratch rather than quoting my old notes. I re-downloaded prices, put every timer, the deployed blend and buy-and-hold through the lab’s own backtest engine, and compared the results with what the research registry had recorded. Every timer’s 2011–2022 Sharpe ratio matched the registry to two decimal places. The sealed period ends on 12 August 2026, where the economic data the timers read currently stops, so no signal ran on stale inputs.
Rerunning also caught a mistake in my own notes: they dated the 2025 sell-off from 4 March to 10 June, which misses most of the fall. Measured from the prices, the peak was 19 February and the bottom 8 April, and everything above uses those dates.