Nov 2026
Recording every new token forward, pre-registering every rule, and a real-money post-mortem that blamed the safety stops, not the strategy.
Quant, Research, Crypto, Python, Next.js
New to some of the terms? See the glossary at the end.
After my last few posts, someone gave me blunt feedback: stop testing retail trading lore. Smart Money Concepts, fair value gaps, opening-range breakouts: millions of people trade them, they were tuned on charts by eye, and there’s no economic reason for them to pay. Test ideas with a reason to exist instead, like trend-following, carry and value, the documented risk premia that professional funds actually run.
It’s good advice. It also made me realise I’d never looked at my own research that way. My lab has now registered 161 hypotheses, each written down before it was tested and run through the same pass marks. So I sorted all of them by where the idea came from and checked whether “ideas with a reason” actually did better.
They did, a bit. Not as much as they should have, and the reasons are more interesting than “my ideas were bad”.
I put every hypothesis into one of four groups:
| Group | Tested | Passed every test | Median out-of-sample Sharpe |
|---|---|---|---|
| Chart patterns and technical rules | 23 | 0 | −1.06 |
| Calendar, event and intraday effects | 25 | 3 | −0.52 |
| Published factors and risk premia | 59 | 3 | +0.16 |
| Macro timing signals | 54 | 14 | +0.72 |
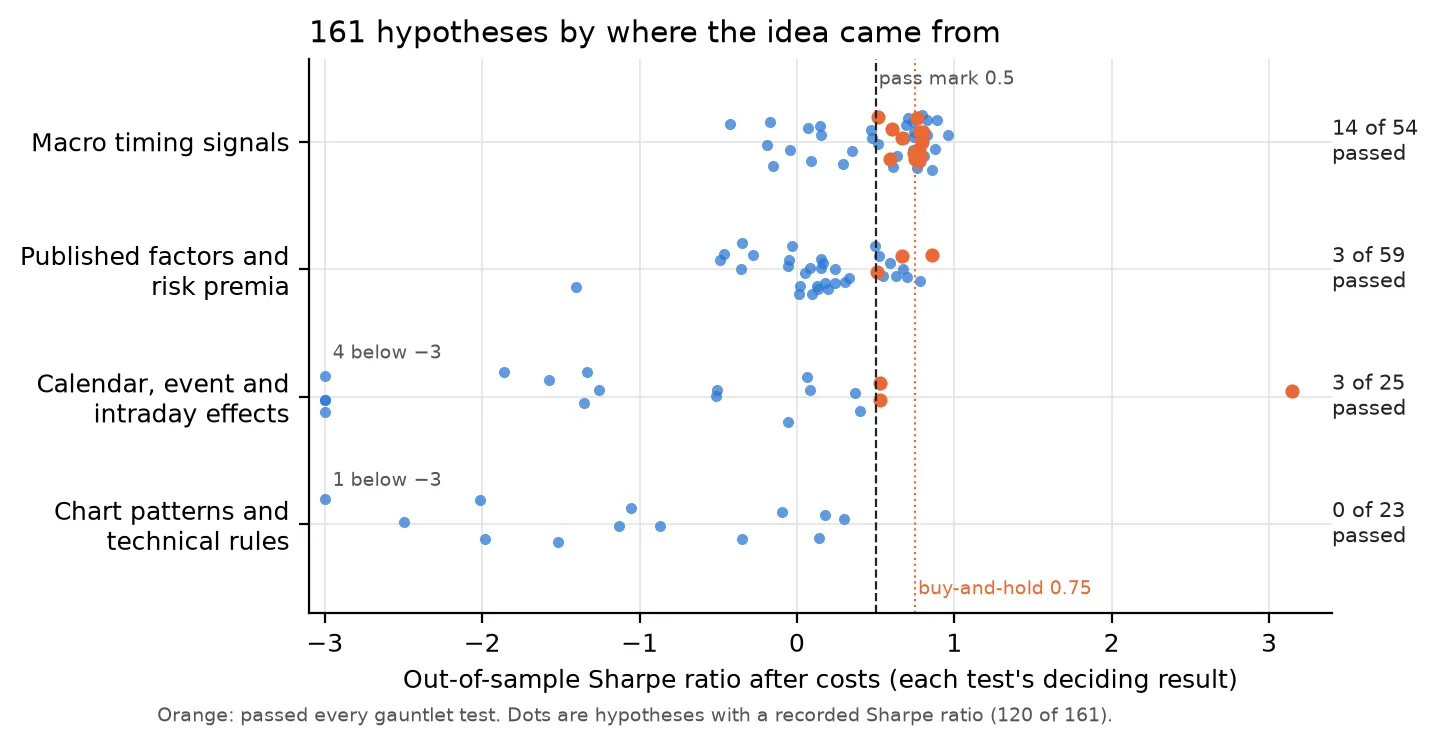
Each dot is a hypothesis with a recorded Sharpe ratio after costs (120 of the 161; the earliest results predate the lab’s structured records). Orange dots passed every test. The buy-and-hold line applies to the macro timers, which all trade the S&P 500 and Nasdaq-100.
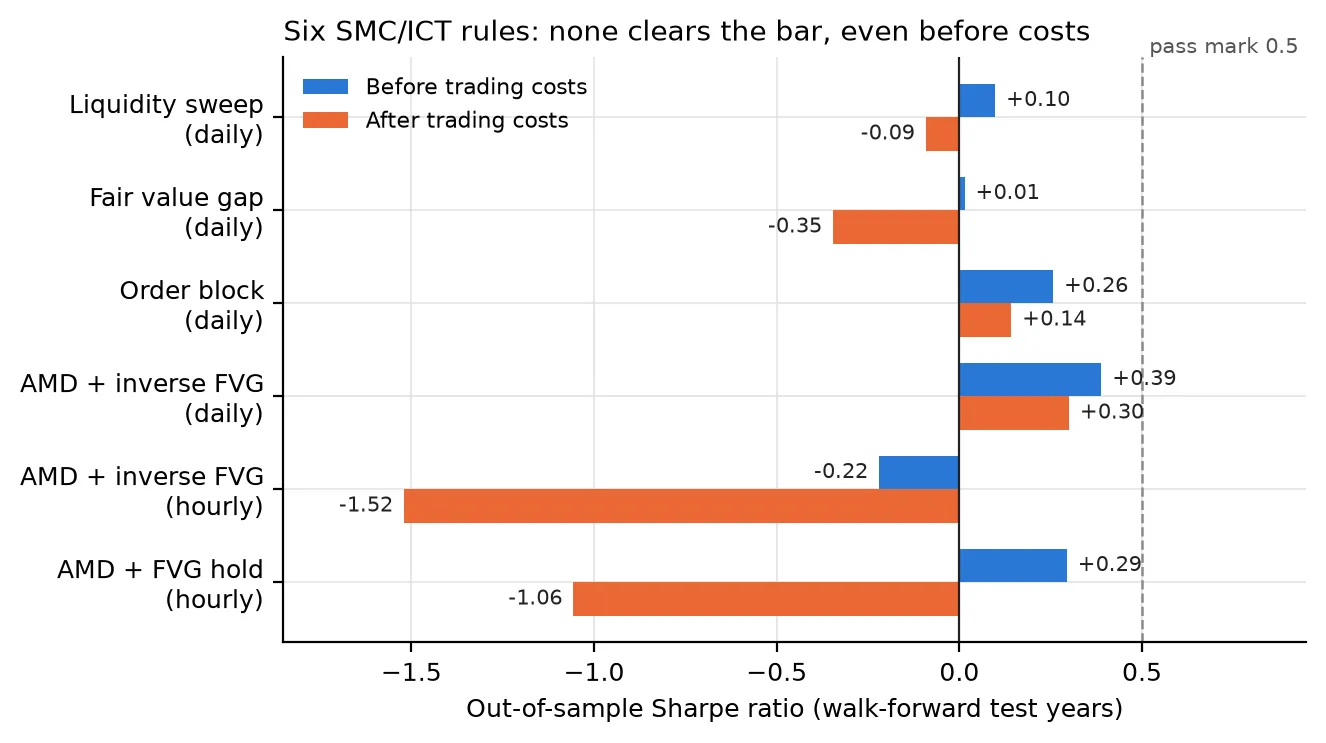
The chart-pattern group is as bad as the feedback predicted. None of the 23 passed. Of the 13 with a recorded Sharpe ratio, the best scored 0.30 and the median was −1.06. I wrote about the Smart Money Concepts tests in detail; the rest of the group failed the same way.
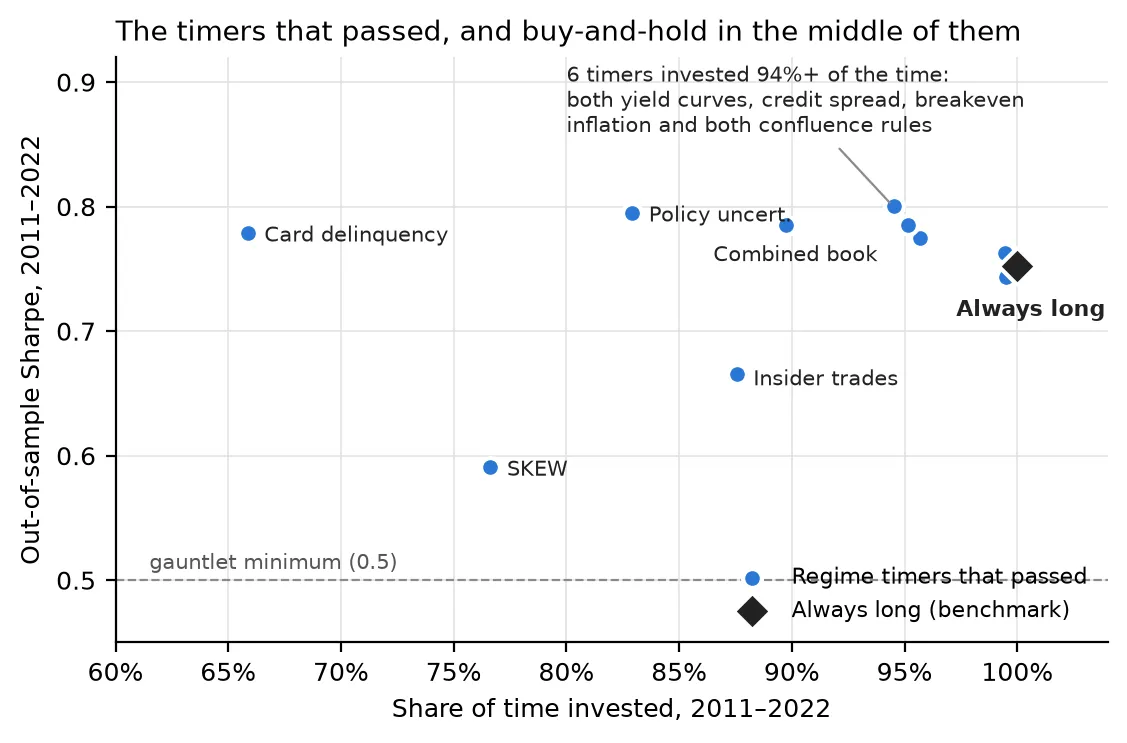
The macro timers look like the clear winners: 14 of 54 passed. But I’ve already shown what that’s worth. Run through exactly the same tests, simply holding the market scored a Sharpe ratio of 0.75, right in the middle of the timers. Most of them were invested nearly all the time, so they were mostly buy-and-hold with extra steps. Their median of 0.72 is the stock market’s Sharpe ratio, not theirs.
Which leaves the group the feedback pointed me to. Published risk premia had a median of 0.16 (over the 36 with a recorded Sharpe ratio), and only 3 of 59 passed.
Mostly, I tested them in a form too small to work.
The research these premia come from uses broad, diversified portfolios. The classic paper on trend-following, Moskowitz, Ooi and Pedersen (Journal of Financial Economics, 2012), traded 58 futures contracts across stock indices, bonds, currencies and commodities. My versions were much narrower:
That’s not evidence these premia don’t exist. It’s evidence that a premium earning a Sharpe ratio of 0.5 to 1 across dozens of markets earns much less in five of them, after costs, over one bad decade. The diversification is the strategy.
Some premia did clear the Sharpe bar and failed elsewhere, mostly for good reasons, such as a 58% drawdown or too many related attempts. Two were thrown out for reasons I now think were mistakes in my own tests.
Trend-following across 25 markets (the textbook 12-month rule on 24 ETFs and Bitcoin) scored a Sharpe ratio of 0.59 out of sample, above the 0.5 pass mark. It failed two tests:
Crypto momentum (Bitcoin and Ether) scored 0.60, and failed walk-forward efficiency the same way (−8.40, from an in-sample Sharpe of −0.07), along with the regime test and a parameter check.
Neither of these would have been a sure thing. The trend version wasn’t really diversified: 19 of its 25 markets were stock funds, and the crypto one rested on three test years. But they were rejected on a broken ratio, not on performance.
I can’t go back and pass them now. Changing the rules after seeing which ideas they hurt is exactly what the rules exist to prevent. The honest fix is to write new pass marks for diversified premia first, then test a properly built portfolio on them.
The two flaws point in opposite directions, which is the lesson. The gauntlet was too strict on diversified premia, because of ratios and regime labels that don’t fit them. And it was too lenient on anything that mostly owned the stock market, because it never asked whether a strategy beat simply holding. A fixed set of tests encodes assumptions about what a strategy looks like, and they don’t fit every strategy.
The other half of the feedback was to look where few quants do. I’ve built a naira yield curve from public data, so I started there.
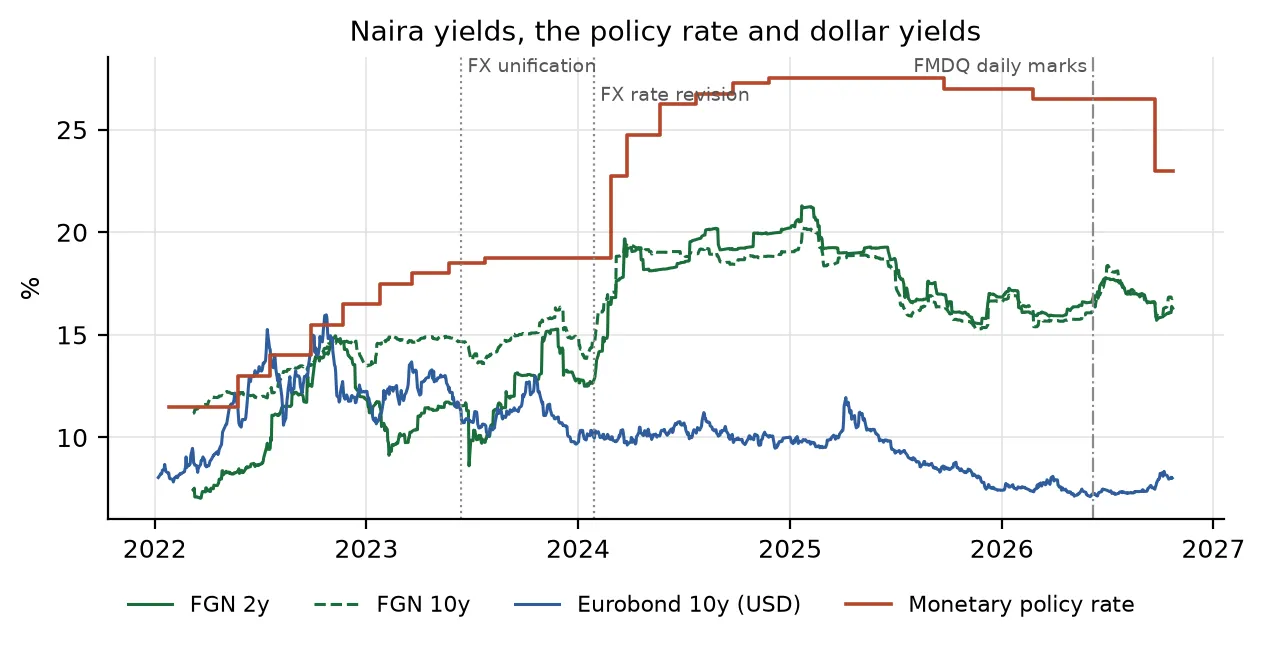
The idea is a documented one with a mechanism: when a government sells new bonds, dealers have to absorb the supply and want a discount for it. Lou, Yan and Zhang (Review of Financial Studies, 2013) found US Treasury yields rise in the days before auctions and fall back after. Nigeria’s Debt Management Office auctions FGN bonds every month, so I pre-registered the same test there, on daily FMDQ prices from 2022 to 2026 and weekly DMO reports from 2010 to 2017.
It wasn’t there. The average yield move before an auction minus the move after was −0.4 basis points over 55 auctions (95% interval −11.3 to +10.1), and −3.0 over 56 auctions in the earlier period. The before-minus-after difference was positive in about half the auctions (49% and 46%). The data can rule out a concession bigger than about 10 basis points, though not one as small as the US estimate. One possible reason it doesn’t carry over: Nigerian banks and pension funds buy at the auction itself rather than selling ahead of it.
So that’s 161, and one more negative. But it’s the first test in a market where I know the data better than most people, and it shows the pipeline works there.
The feedback was right about the chart patterns: 0 for 23. Where it was too optimistic was in thinking that switching to “ideas with a reason” would fix things by itself. A real premium, tested too narrowly or judged by the wrong yardstick, fails just as cleanly as a fake one. The difference is that a fake one fails for good.
Every hypothesis was written down and registered before it was tested. The groupings, the table and the chart come from a script that reads the lab’s registry, and a separate check script compares every number in this post against the registry and the pre-registrations.