Nov 2026
Recording every new token forward, pre-registering every rule, and a real-money post-mortem that blamed the safety stops, not the strategy.
Quant, Research, Crypto, Python, Next.js
New to some of the terms? See the glossary at the end.
Here’s something that surprised me when I started this project: there’s no free, public yield curve for Nigeria’s own government bonds. Paid data services may have one, but if you’re a student, a journalist or just curious, there’s nothing to look at.
All the ingredients are out there. The Debt Management Office (DMO) publishes bond prices. FMDQ, Nigeria’s fixed-income exchange, marks every bond at the end of each trading day. The Central Bank (CBN) publishes its auction results. But nobody stitches them together into a curve you can actually look at, and nobody seems to check what that curve does when the Monetary Policy Committee (MPC) changes interest rates.
So I built one. This post walks through what I found along the way: a five-year hole in the data, prices that barely move, and one result I genuinely didn’t expect. Bond yields move before the central bank announces a decision, not after. And when I went back to 2010 to see if it was always like that, it wasn’t. If you want every method and number, the full write-up is an 11-page PDF.
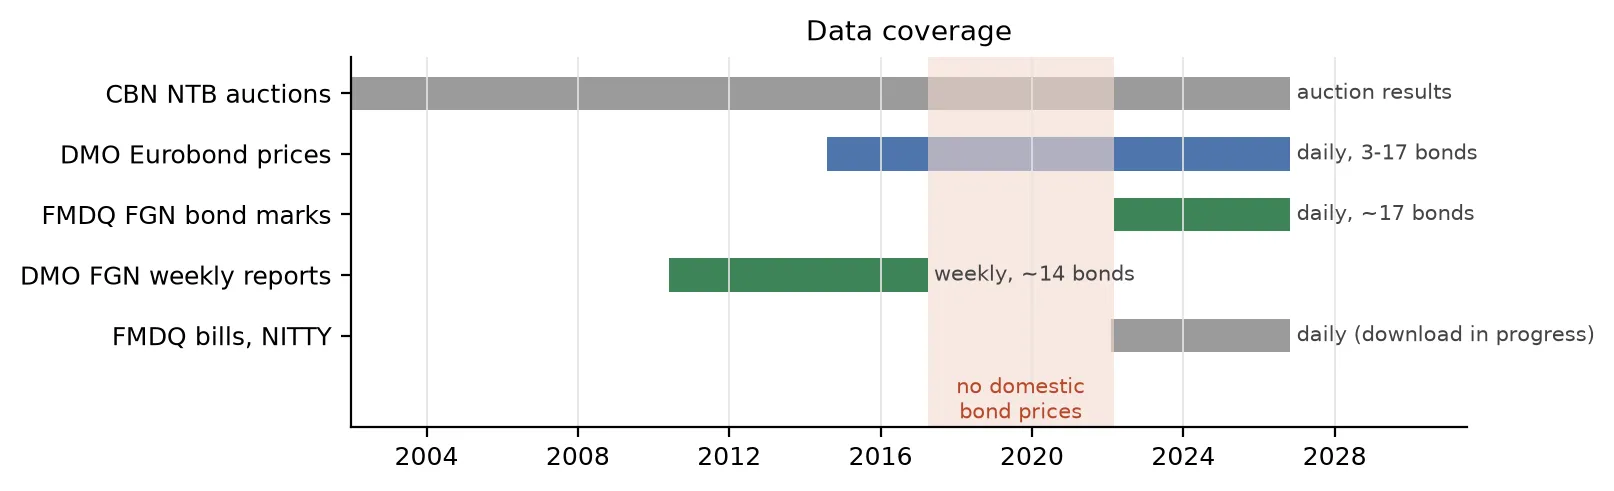
Which public source covers which years.
The first thing I tried to do was go as far back as possible. That didn’t go well.
FMDQ’s daily price sheets start in March 2022. Before that, the DMO published weekly bond reports from 2010 until March 2017, and then simply stopped. In between, from April 2017 to February 2022, I couldn’t find a single public domestic bond price. I went through FMDQ’s site and dug through web archives. Nothing.
So the main story here starts in March 2022: 1,133 trading days and 26 bonds, with about 17 of them quoted on a typical day. The older weekly reports come back later, for a before-and-after comparison.
The dollar side was kinder. The DMO has published daily prices for Nigeria’s dollar Eurobonds since 2014 (3,076 PDFs, and spreadsheets later on), and the CBN quietly serves its Treasury-bill auctions back to 2002, plus the exchange rate and inflation, through JSON endpoints behind its website.
One rule I set early: FMDQ’s data is licensed, so I never republish its raw prices. Every chart in this post is a fitted curve or something calculated from one.
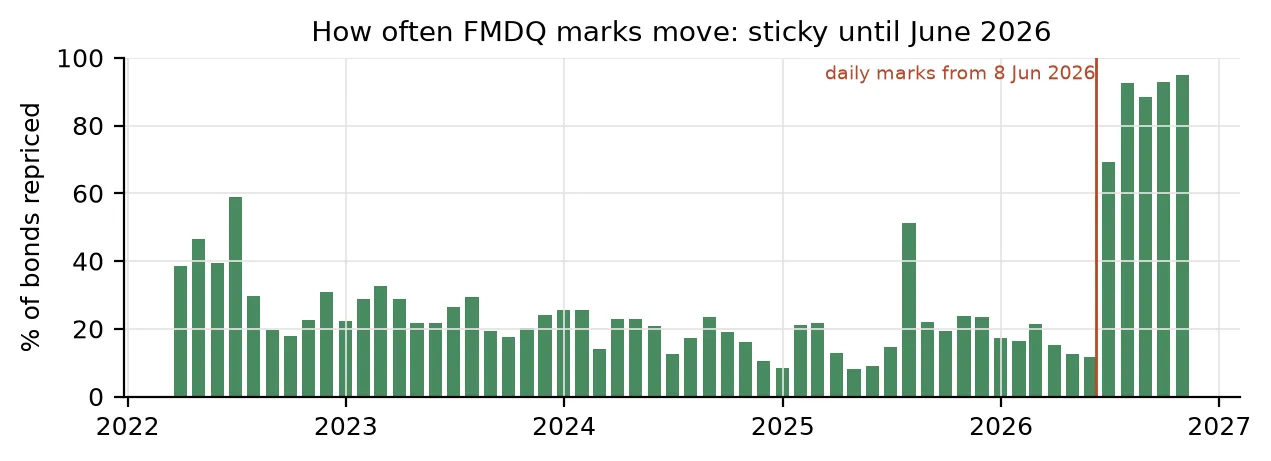
Share of FGN bonds whose FMDQ mark changed from the day before, monthly average.
The next surprise was how still the data is. On a typical day until mid-2026, only 18–32% of bonds get a new price; the rest are copied from the day before. On about one day in eight, nothing changes at all.
Then something odd happened. For a full week, 29 May to 5 June 2026, no bond price moved. After that, almost every bond started repricing every single day. My best guess is that FMDQ changed how it marks bonds.
Why should you care? Imagine the market reacts to a rate decision on a Tuesday, but the price on the sheet only catches up the following Monday. Look at just one day and you’d conclude nothing happened. So I measure everything over week-long windows, and treat June 2026 as a break in the data.
To turn scattered bond prices into a smooth curve, I used a Nelson–Siegel fit. It’s a standard method that describes a whole curve with four numbers: roughly, its level, its slope and its hump. Three adjustments made it work on Nigerian data:
Even then, the two markets look very different. The typical fit error is 32 basis points for naira bonds and just 9 for dollar Eurobonds. Part of that is noisy prices, but a lot of it is real: two naira bonds maturing in the same year can genuinely trade at different yields, depending on who holds them and how often they trade.
I also assumed I could use the CBN’s one-year Treasury-bill rate to anchor the short end of the curve. I was wrong. From mid-2023 the bill rate sat 2–7.6 percentage points above where the bonds put the one-year point. Bills and bonds were pricing different things.
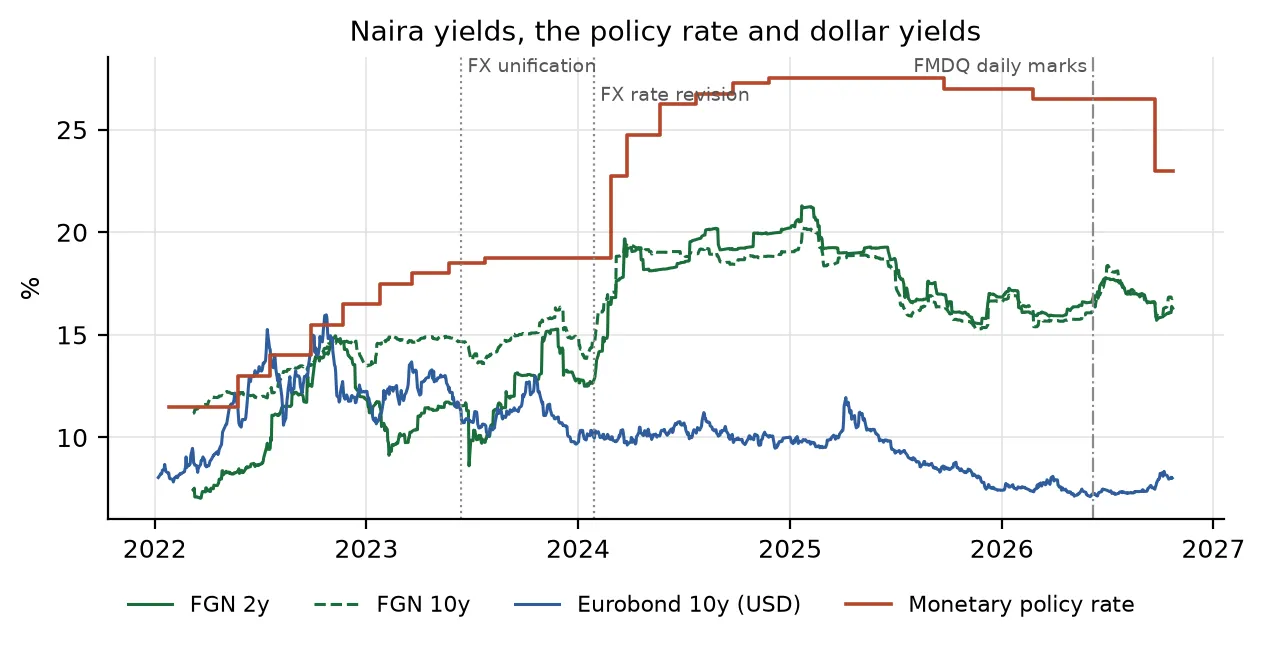
Fitted naira 2- and 10-year yields, the policy rate and the 10-year Eurobond yield.
When I broke the weekly moves down into their main patterns (a principal component analysis), the difference between the two markets jumped out.
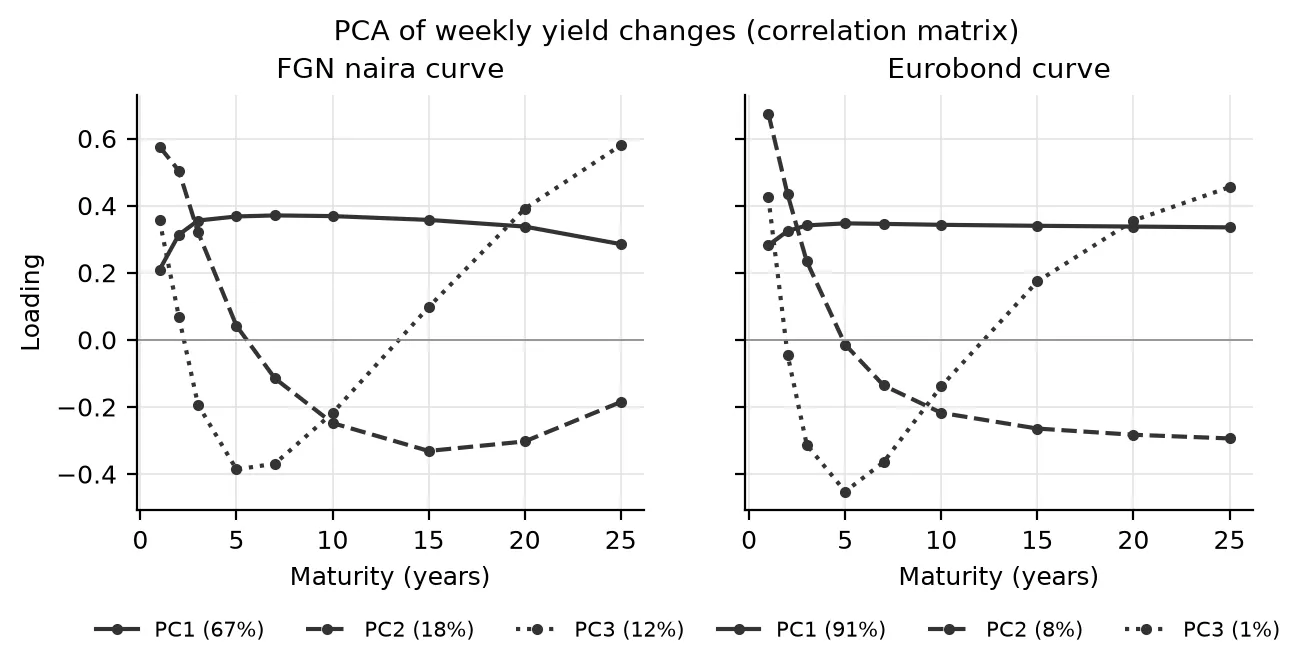
Loadings of the first three principal components of weekly yield changes.
The dollar curve mostly moves as one block: a single “level” pattern explains 91% of its weekly moves. That’s what you’d expect when the main question investors are asking is “how risky is Nigeria?”. The answer moves every maturity at once.
The naira curve is messier. The level pattern explains only 67%, and the slope (18%) and curvature (12%) do real work. Interest-rate decisions, bank liquidity and inflation fears all hit different parts of the naira curve in different ways.
This was the question I was most curious about: when the MPC changes rates, what happens to bond yields? I took the 23 MPC decisions between March 2022 and July 2026 that were hikes, holds or cuts, and asked whether the size of the rate change predicted how much the two-year naira yield moved.
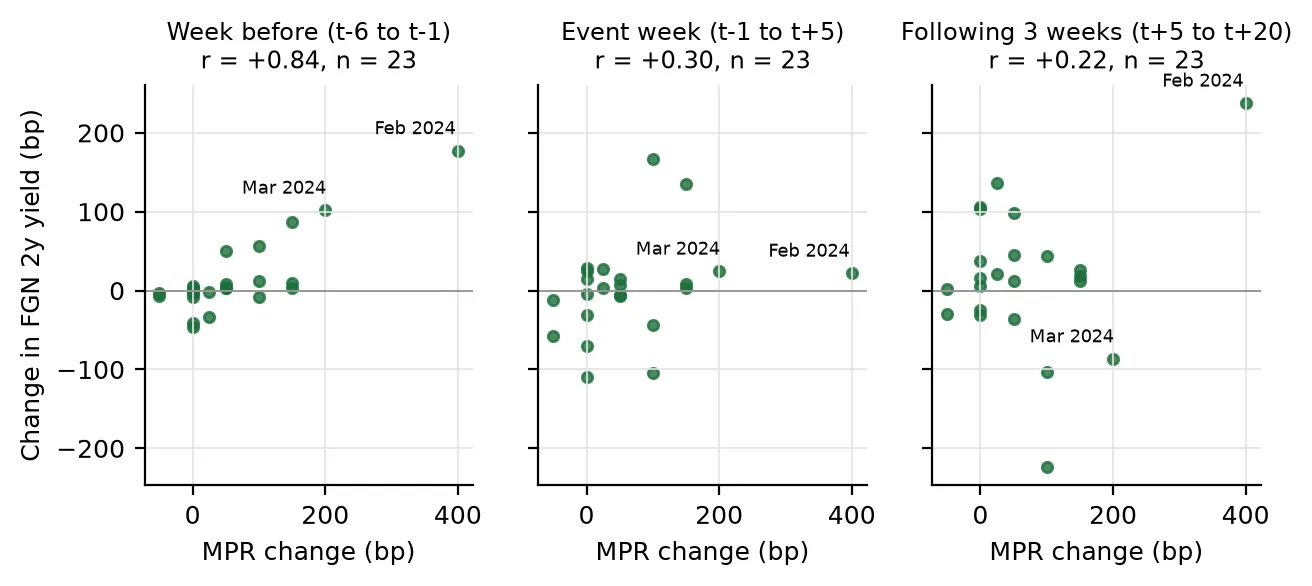
Each dot is one MPC decision.
| Window | Correlation | p-value |
|---|---|---|
| Week before the meeting | +0.84 | < 0.001 |
| Week of the meeting | +0.30 | 0.17 |
| Three weeks after | +0.22 | 0.28 |
I expected the reaction to show up in the week of the meeting. It mostly doesn’t. It shows up the week before. In February 2024, ahead of a 400 basis-point hike, the two-year yield rose 177 basis points in the six trading days before the announcement, and just 22 in the week of it.
I want to be careful with this one. Two huge hikes, February and March 2024, do a lot of the work, and the typical hike is far quieter: the median move before a hike is only 9 basis points. Take those two out and the correlation drops to +0.54. That’s weaker, but still well beyond chance (p = 0.01), and the rank correlation is +0.63, so it isn’t just two dots on a chart. The sticky prices can’t explain it either: stale prices make reactions show up late, never early.
And February 2024 comes with an asterisk of its own. Its “week before” fell right in the middle of a devaluation sell-off (more on that below), so some of that 177 basis points was the market reacting to the naira, not guessing the hike. Another reason to lean on the version without it.
When something surprises you, the obvious next question is whether it was always true. The DMO’s weekly reports from 2010 to 2017 let me check. Getting them into shape took some work: 330 PDFs in four different layouts, many of them printing every character two or three times over, so “30-Jan-12” comes out as “30-Jaan-12”. Even the dates needed care: the CBN’s own index lists some old communiqués weeks after the meeting itself.
That period had its own tightening cycle, including a 275 basis-point hike on 10 October 2011, plus a 200 basis-point cut in November 2015 and two hikes in 2016. Weekly data can’t split one day from the next, so I reran the test in weeks for both periods, to compare like with like:
| Weekly test | Week before the meeting | Meeting week |
|---|---|---|
| 2010–2017 (36 meetings) | +0.11 | +0.60 |
| 2022–2026 (23 meetings) | +0.77 | +0.07 |
Back then, the market moved when the CBN announced. The two-year yield jumped 355 basis points in the week of the October 2011 hike, fell 285 in the week of the November 2015 cut, and rose 156 in the week of the July 2016 hike. In 2022–2026, the big moves came a week early.
The usual caveat applies: both periods lean on a handful of big decisions, and without the two largest from 2010–2017 the old pattern gets a lot weaker. What holds up is the flip in timing. Why it flipped, prices alone can’t tell me. Clearer signals from the CBN, a market that has learned how the CBN reacts to inflation and the naira, or just the much bigger moves of the recent cycle could all play a part.
My first guess was that the CBN was tipping its hand through its own Treasury-bill auctions, pushing rates up before a hike. The first version of this post said it wasn’t. That was wrong, and the way I got it wrong is worth telling.
I had compared only the last two auctions before each meeting. Before the February 2024 hike, both were at the same rate, so it looked like nothing happened. But the CBN had already moved. On 7 February it took the one-year auction rate from 11.5% to 19%, three weeks before the meeting, and then simply held it there. Looking back four weeks instead of two changes the picture.
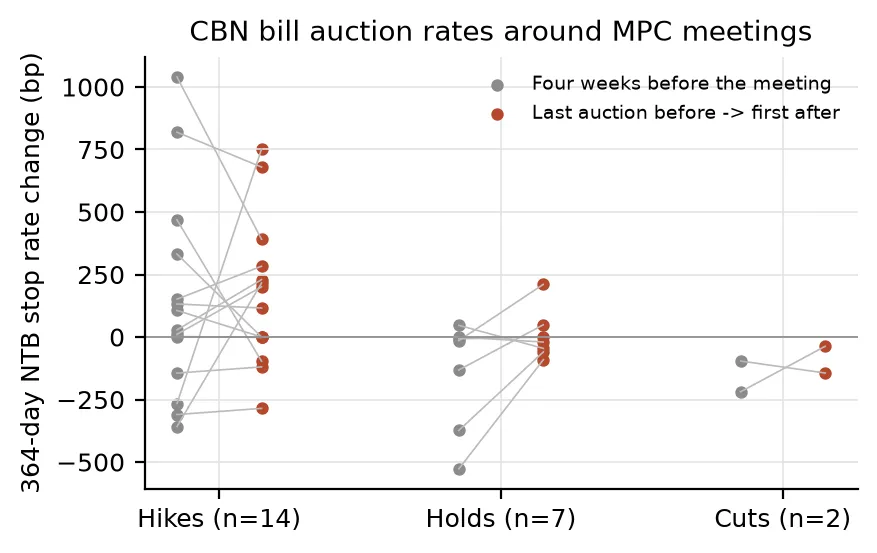
364-day bill stop rate over the four weeks before each meeting (grey), and from the last auction before to the first after (red).
Over the four weeks before a meeting, the auction rate rose 144 basis points on average ahead of hikes. The timeline for February 2024 is striking: the CBN lifted its auction rate on 7 February, the bond market repriced in a single day on 22 February (the two-year yield jumped 158 basis points), and the 400 basis-point hike came on 27 February.
So for its biggest hike, the CBN did signal through its own auctions, and that explains part of the bond market’s anticipation: the correlation drops from 0.84 to 0.72 once you account for it. For the other meetings, though, the auctions explain very little.
That left two other suspects: the CBN’s own short-term paper (OMO bills) and the secondary market where bills trade every day. FMDQ publishes daily prices for both, plus a benchmark bill rate called NITTY, so I pulled all of it in: about 3,000 more spreadsheets, in more layouts than I’d like to admit.
Neither one leads the MPC. In the week before a meeting, none of the bill measures moves with the size of the coming decision in any convincing way (the correlations sit around +0.2 to +0.3, and none passes a significance test). After accounting for all of them at once, the bond market’s correlation is still 0.87. If anything, the gap between bill yields and short-dated bonds narrows before hikes, because the bonds move and the bills don’t.
So apart from that auction signal before the biggest hikes, the anticipation lives in the bond market itself. What feeds it isn’t something prices alone can tell me. I checked the CBN’s own publications too: speeches are rare (two to six a year lately), and the notice of each meeting comes out only days before it. The governor’s two briefings to the National Assembly in early February 2024 didn’t move yields at all.
If the bond market moves before the MPC, the obvious explanation is that everyone could see the decision coming. To check, I went back through what analysts actually published before each meeting: previews in BusinessDay, Nairametrics, New Telegraph, ThisDay and others. I found a dated preview for 21 of the 23 decisions, and read every one to note what the analysts expected.
The published consensus got it wrong surprisingly often. Analysts expected a hold before the 100 basis-point hike of July 2022, the 150 basis-point hike of September 2022, the 100 basis-point hike of November 2022 and the 50 basis-point hike of March 2023.
So I split each decision into two parts: what analysts expected, and the surprise (what actually happened minus what they expected). Leaving out the two big 2024 hikes, the bond market’s move in the week before a meeting has almost nothing to do with the expected part (a correlation of +0.07). It lines up with the surprise instead (+0.61, well beyond chance). Before the July 2022 hike the two-year yield rose 56 basis points; before September 2022, 86; before March 2023, 50. All three were hikes the analysts said wouldn’t happen.
In other words, the bond market wasn’t just pricing in the published consensus early. It moved ahead of the part the consensus missed. It’s also the finding I’d hold most loosely: some previews quote a single forecaster, and 19 meetings is a small sample.
Were the surprises at least close calls inside the committee? No. I went through how every member voted, from the communiques up to 2023 and from each member’s published personal statement after that. In July, September and November 2022 every single member voted to hike, and in March 2023 eleven of twelve did. They argued about how much, not whether. The analysts were calling holds against a committee that had largely made up its mind.
The votes held a few surprises of their own. The February 2024 hike was announced as unanimous, but the members’ own proposals ran from 100 to 450 basis points, and only half of them voted for the 400 that was chosen. In March 2024 only five of twelve backed the 200 basis-point hike that went through, and one wanted to hold. Still, the votes don’t help explain the bond market: once you know the decision, how split the committee was tells you nothing more about how yields moved beforehand.
So where did the market’s early read come from? I went looking for the days the moves actually happened on. I collected the dates of the inflation releases, all 58 of the DMO’s monthly bond auctions since 2022 and the CBN’s Treasury-bill auctions, then split each pre-meeting move into what happened on those days and what happened on the rest.
My first guess was the inflation release, which usually lands a week or so before the meeting. It isn’t that. Yields barely react to inflation news, and before the July and September 2022 hikes they actually fell on the release day.
It’s the auctions. Leaving out the two big 2024 hikes, the part of the pre-meeting move that happened on auction and release days lines up with the analysts’ surprise (+0.66). The part on every other day doesn’t (−0.29). The individual cases make it concrete:
The CBN sets Treasury-bill auction rates itself, and it runs the bond auctions for the DMO. So “the market knew what the analysts didn’t” mostly means the bond market was reading the central bank’s own auctions, and the previews weren’t. There’s one case the auctions can’t explain: in March 2023 yields rose on a day with nothing scheduled, as the overnight interbank rate climbed. And the evidence is moderate rather than strong. Auction and release days are 43% of all trading days, so they’d catch part of any move by chance; when I shifted the calendar around at random, about 4% of the shifts did as well as the real one.
Dollar Eurobonds don’t care about MPC decisions at all. Across all 23 decisions, the 2022 hikes included, the correlations sit between −0.01 and +0.10 in every window. The FX unification of 14 June 2023 is a completely different story, and I only noticed it while drawing this chart.
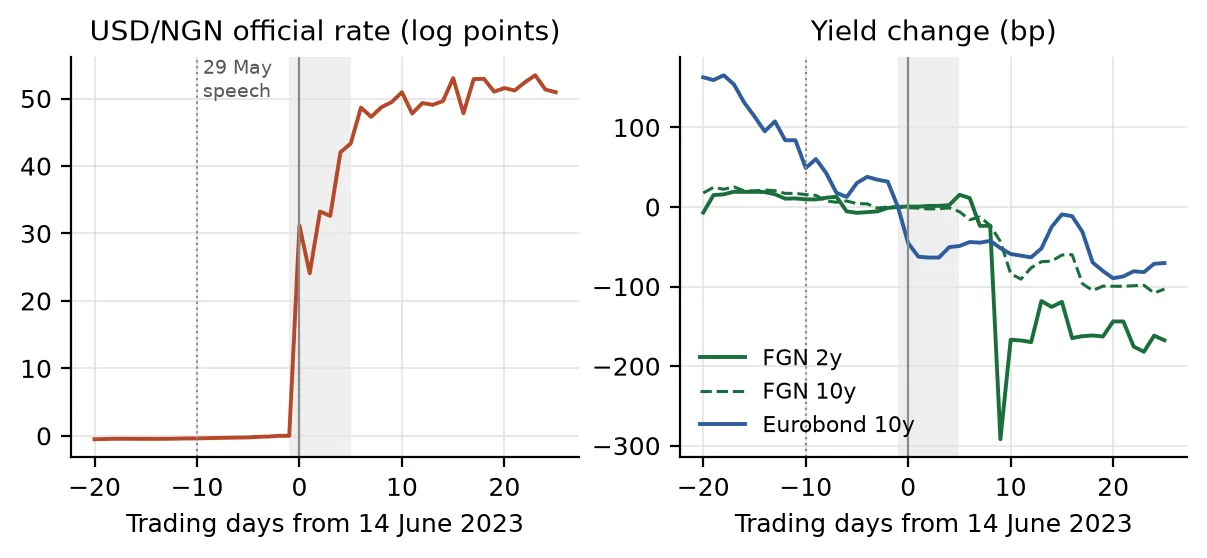
Moves relative to the day before unification. Shaded: the event week. Dotted: the 29 May inauguration speech.
The week the naira was let go, it lost about a third of its value against the dollar, and naira bond yields barely flinched. But look at the blue line. The 10-year Eurobond yield had already fallen about 210 basis points over the month: 82 in the two weeks before the 29 May inauguration speech, 83 more between the speech and unification, and 46 on the day itself. Dollar investors had priced the reforms in as good news for Nigeria’s credit before the exchange-rate step even happened. The naira market caught up afterwards, with the two-year yield falling 159 basis points over the following three weeks.
So I went back and added the speech as an event of its own, using the State House transcript (“The Central Bank must work towards a unified exchange rate”). Sure enough, the 10-year Eurobond yield fell 47 basis points in the week before it and 54 in the week of it, while the naira two-year hardly moved.
Seven months later there was a second big FX step, and it played out the opposite way. On the evening of Friday 26 January 2024, after the market had closed, FMDQ published a notice changing how the official exchange rate is calculated, effective the following Monday. The official rate jumped 29% in a single day.
The same chart as above, now with both FX events marked.
This time dollar investors shrugged: the 10-year Eurobond moved just 7 basis points. It was the naira market that took the hit. The two-year yield rose 138 basis points that week and the ten-year 142, roughly four times a normal week’s move at that maturity, and the two-year added another 258 over the next three weeks. Then came February’s 400 basis-point hike.
Two FX shocks, opposite reactions. In 2023 the market read the move as a reform that made Nigeria a better credit. In 2024 it read it as an inflation problem that would mean higher naira interest rates. Which, as it turned out, it did.
There’s plenty left to do:
Under the hood it’s Python and Postgres: a scraper for each source, parsers, the curve
fitting, the analysis and the charts, all behind a single reproduce command. The code is available on request. The
write-up has the details, including an honest list of
everything this data can’t tell us.