Nov 2026
Recording every new token forward, pre-registering every rule, and a real-money post-mortem that blamed the safety stops, not the strategy.
Quant, Research, Crypto, Python, Next.js
New to some of the terms? See the glossary at the end.
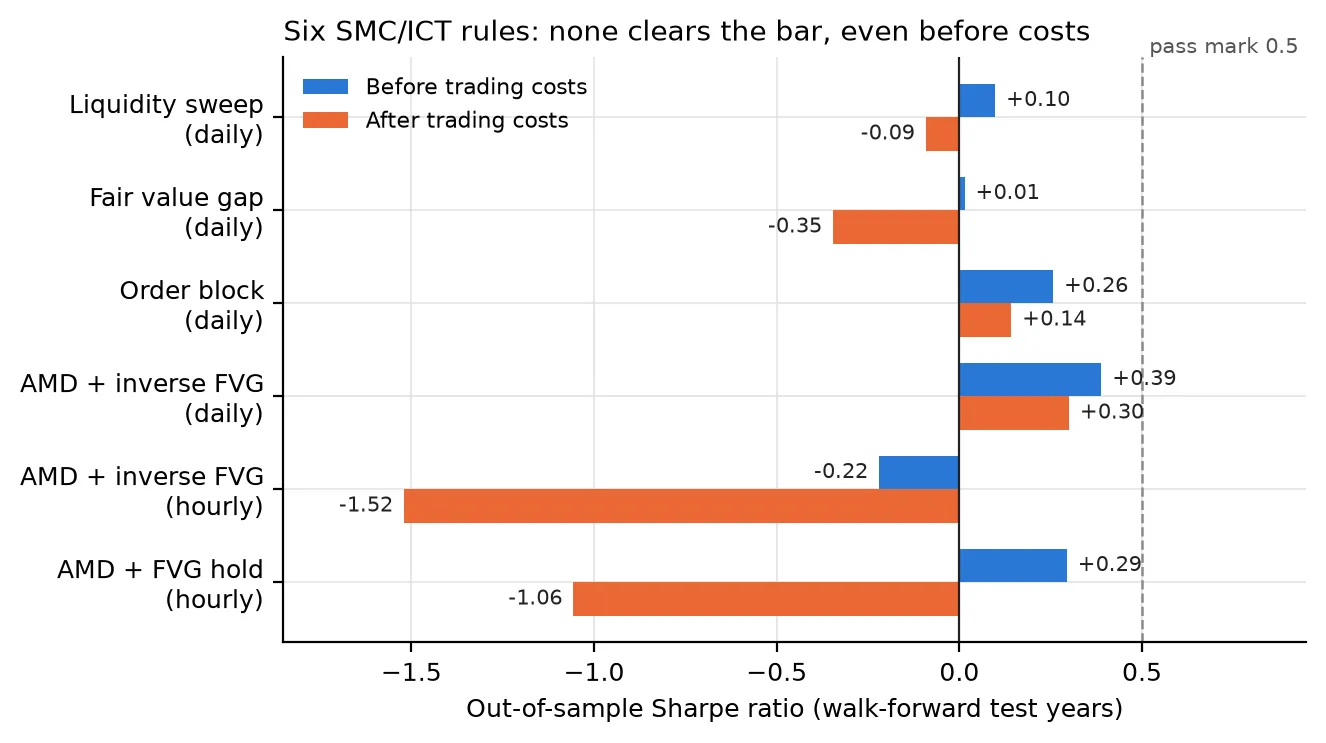
My last two research posts ended the same way. Smart Money Concepts and a batch of stock day-trading rules all failed, and costs did a lot of the damage. One of the stock rules was genuinely interesting: it had a real edge before costs and still lost badly after them.
A question I got afterwards was the obvious one. What about index futures, the Nasdaq or US30? They cost a tiny fraction of what single stocks do. So I tested that, properly, and the answer turned out stranger than “yes” or “no”.
The stock rule was simple. Late in each trading day, take 52 large US stocks, buy the five that had fallen most in the second-to-last hour and short the five that had risen most, and close everything at the bell. Over 2023 to 2025 it worked before costs: a Sharpe ratio of +1.57. After charging 10 basis points on each side of every trade, it was −7.14.
Because the cost is the same every day, you can work out where it breaks even: at about 1.8 basis points per side. Ten was probably too harsh for the biggest stocks, but 1.8 is very tight for a basket of single names. That matches the research on trading costs: Novy-Marx and Velikov (Review of Financial Studies, 2016) found that few strategies turning over more than half their portfolio a month survive costs, and this one turns over all of it every day.
Index futures are a different world. One trade in an E-mini Nasdaq or Dow contract costs a small fraction of a basis point all in, roughly 30 to 100 times less than the stock assumption.
You can’t move the stock strategy onto a future. It made money from stocks diverging from each other, whichever way the market went. A future only lets you bet on the market’s direction. So the question changes to: is there a pattern in the index’s own late-day move?
There is a well-known one. Gao, Han, Li and Zhou (Journal of Financial Economics, 2018) found that on the S&P 500 ETF from 1993 to 2013, the return from the previous close through the first half-hour of trading predicts the direction of the last half-hour. Baltussen, Da, Lammers and Martens (Journal of Financial Economics, 2021) found a broader version across more than 60 futures markets from 1974 to 2020: the return from the previous close up to 30 minutes before the close predicts the last 30 minutes, in the same direction. They linked it to options dealers and leveraged ETFs hedging into the close.
One thing went wrong early, and it’s worth saying how it was handled. I had planned to start in 2008, but the data source returns empty days before about 2013, which my first check missed because it only looked at whether the server answered. I caught it before any result existed, wrote the change into the pre-registration, and started the test in 2014 instead.
Everything from January 2023 onwards stayed sealed, not even downloaded, until the final test.
The first rule was the 2018 paper’s: if the index is up from yesterday’s close to 10:00, buy the last half-hour; if it’s down, sell it. Over 2014 to 2022 it had a Sharpe ratio of −0.24 before costs and −0.51 at futures costs. Trades won 48.9% of the time. Whatever was there in 1993 to 2013 didn’t show up afterwards, in either half of the period or in either of the variations I’d registered.
The second rule was the stock idea at the index level: fade the move between 15:00 and 15:30. It lost money before costs, and not by chance: the average trade lost 1.16 basis points, with a 95% interval that excludes zero. Between 2014 and 2022, the index’s late afternoon tended to carry on into the close.
That pointed straight at the second paper’s version. By my lab’s rules, though, a pattern found by losing money the other way doesn’t get to be called a winner. It needs its own pre-registration and data it hasn’t seen.
So I wrote up the 2021 paper’s rule exactly: take the index’s move from yesterday’s close to 15:30, and trade the last half-hour in the same direction. Because the 2014 to 2022 data had already been looked at for the first two tests, I decided in advance that only the sealed 2023 to 2026 data would count. 2014 to 2022 would be shown for context and couldn’t rescue it.
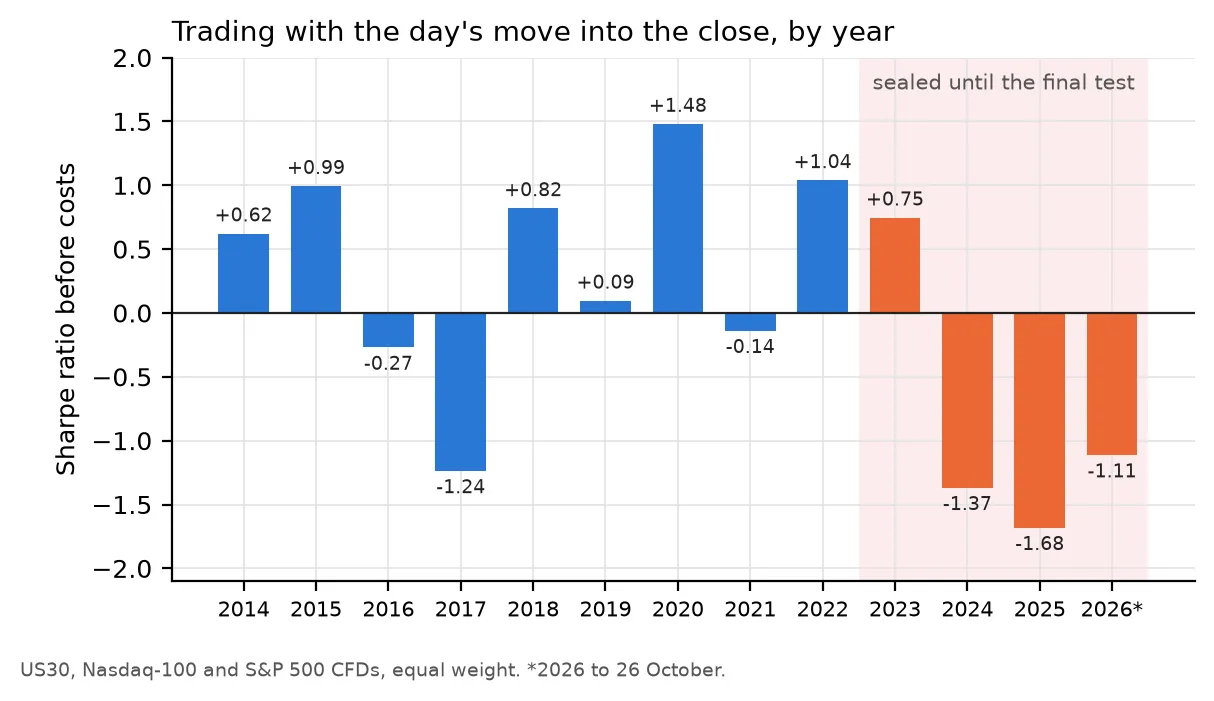
Trading in the direction of the day’s move from 15:30 to the close, before costs. Orange years were sealed until the final test.
Over 2014 to 2022 it worked, as the paper said it should: +1.27 basis points per trade before costs, a Sharpe ratio of +0.64. That’s not enough to trade at retail CFD costs, but with futures-level costs it would have been profitable, if modestly.
Then I opened the sealed data. Over January 2023 to October 2026 the same rule lost 1.08 basis points per trade before costs, with a 95% interval below zero. Its Sharpe ratio was −0.92 before costs and −1.35 at futures costs. Trades won 47.7% of the time. It lost in all three indices and on both calm and volatile days.
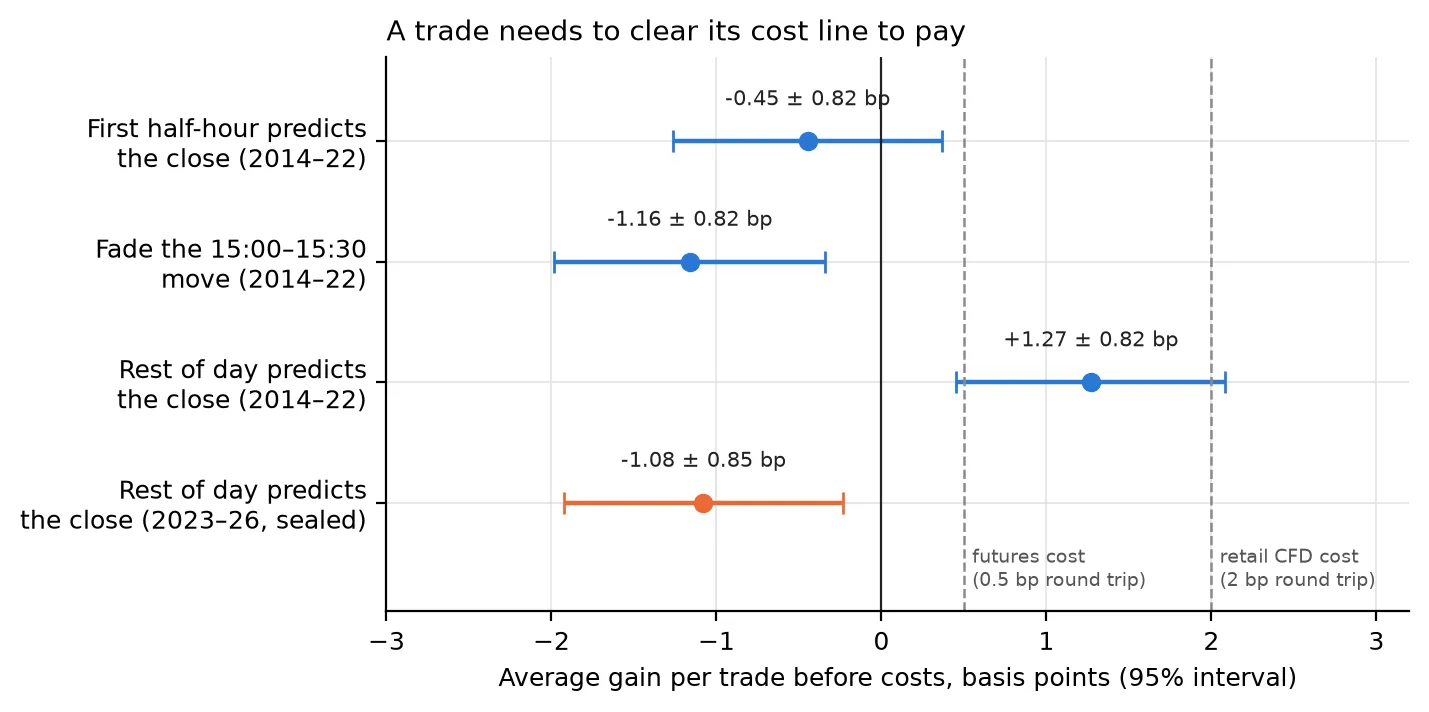
Average gain per trade before costs, with a 95% interval, for each test. To be worth trading, the whole interval would need to sit to the right of the cost line.
The year-by-year chart shows it wasn’t a slow fade. 2022 was one of the best years (+1.04) and 2023 was still positive (+0.75). Then 2024 came in at −1.37, 2025 at −1.68 and 2026 so far at −1.11. Something about how the index trades into the close changed around 2024.
I don’t know, and I’d rather say that than dress up a guess. There are candidates:
There’s a neater observation in my own results. The stock rule that worked before costs (Sharpe +1.57) did so over 2023 to 2025, and the index pattern turned negative from 2024. In recent years, late-day moves have tended to reverse at both the stock and the index level.
The obvious next thought is “fine, fade the move into the close then”. I’m not, for the same reason I didn’t flip the failed Smart Money rules: I found the reversal on the sealed data, so that data can’t also be the evidence for it. Testing it honestly means writing the rule down now and watching it on data that doesn’t exist yet, which means paper trading forward from here. If it’s still working in a year, it might be worth something.
It shows that the best-documented intraday pattern in stock indices, run exactly as published on the Dow, Nasdaq-100 and S&P 500 at futures-level costs, worked from 2014 to 2022 and reversed from 2024 to October 2026. It doesn’t show that intraday momentum is dead everywhere; the 2021 study covered bonds, commodities and currencies too, which I didn’t test. These are CFD prices rather than futures, the history only starts in 2014, and almost four years is a short final exam.
And it answers the original question in a way I didn’t expect. Moving to index futures does fix the cost problem. It just doesn’t hand you an edge to go with it.
Every rule and pass mark was written down and committed before the data it was judged on was downloaded. All the figures here come from those committed scripts, and a separate check script compares every number in this post against their output.