Nov 2026
Recording every new token forward, pre-registering every rule, and a real-money post-mortem that blamed the safety stops, not the strategy.
Quant, Research, Crypto, Python, Next.js
New to some of the terms? See the glossary at the end.
For about a year, from 2025 into 2026, I hunted for trading signals. Not by tinkering until a chart looked good, but with rules: every idea was written down and registered before I tested it, run through the same five tests, and either killed or kept. I looked at currencies, gold, US stocks and ETFs, crypto, volatility, pairs of similar stocks, calendar effects, and how markets behave around US Federal Reserve meetings.
By the time I first wrote this up, I’d tested 33 ideas and the note was titled, honestly, “Thirty-three failures”. Nothing had survived. By 56 ideas, something more interesting had happened. Four ideas passed every test I’d set, and then fell apart, or failed to confirm, on data they had never seen.
This post is about that gap between “it passed the backtest” and “it’s real”, and about a second mistake I only caught by going back over my own old verdicts.
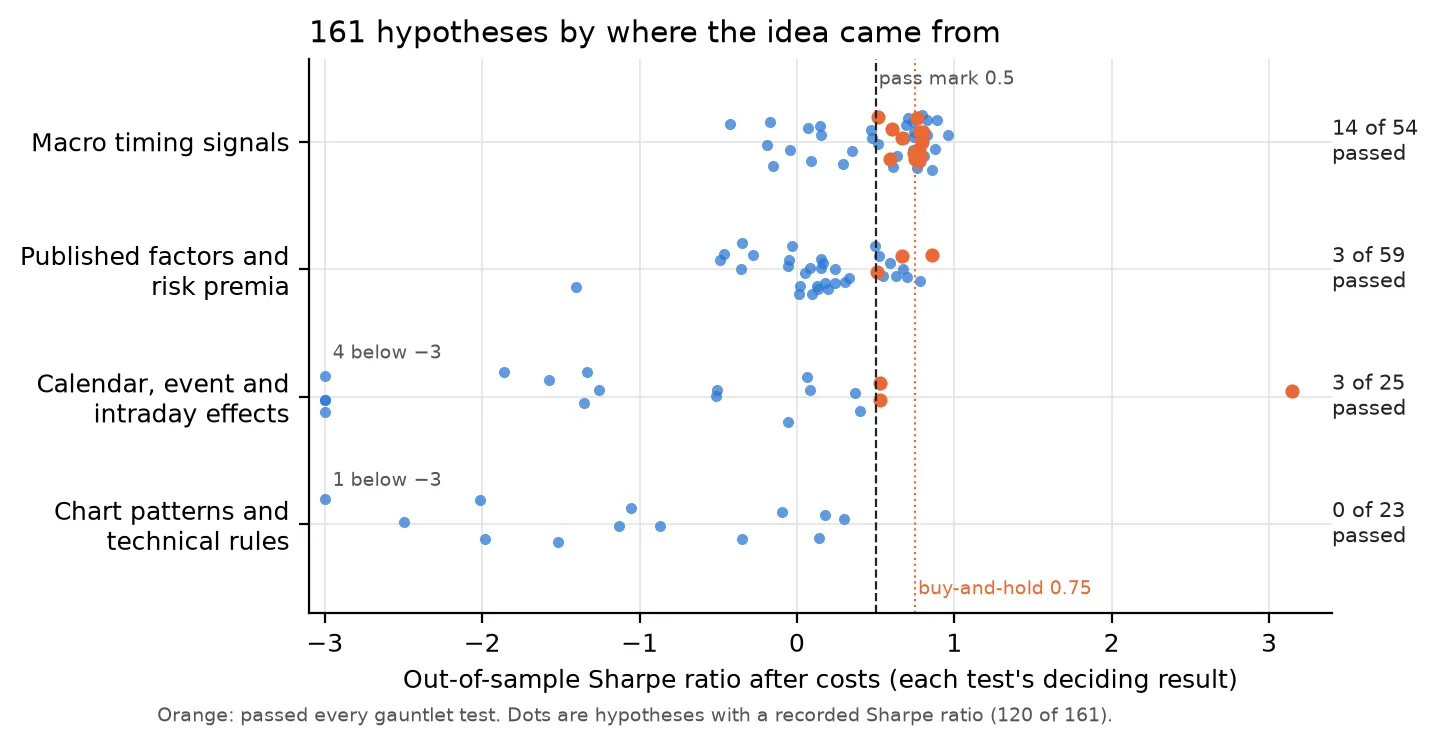
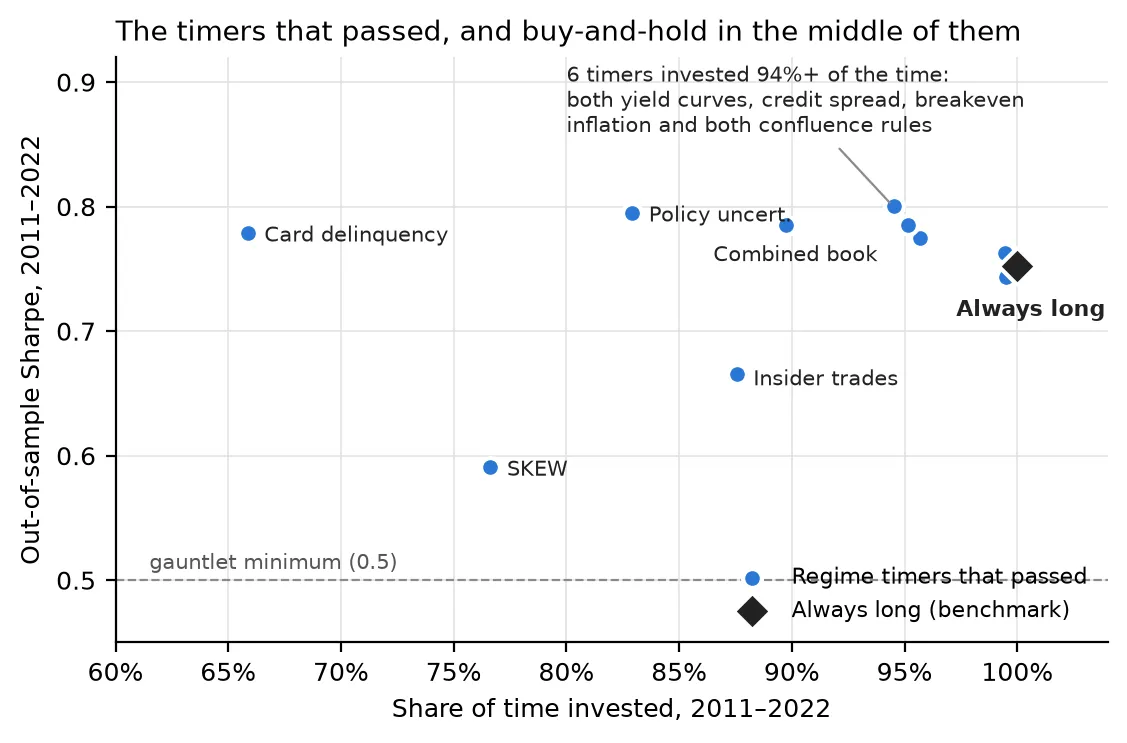
Update, October 2026. This post covers the first 56 hypotheses. The registry has since grown to 157. Two changes matter. The one “inconclusive” survivor below (turn of the month) was later downgraded. And a group of equity regime-timing signals, such as credit spreads and yield-curve inversion, passed the gauntlet and then held up on the unseen 2023–2026 data, the first gauntlet passes to do so. But that window was a strong bull market: simply holding SPY and QQQ scored a Sharpe ratio of 1.38 over it, and the three timers I can line up against that scored 0.77, 1.29 and 1.36. They survived; none has yet been tested through a bear market or shown to beat buy-and-hold.
I called them the gauntlet. I fixed them before testing anything, and I never loosened them when an idea came close:
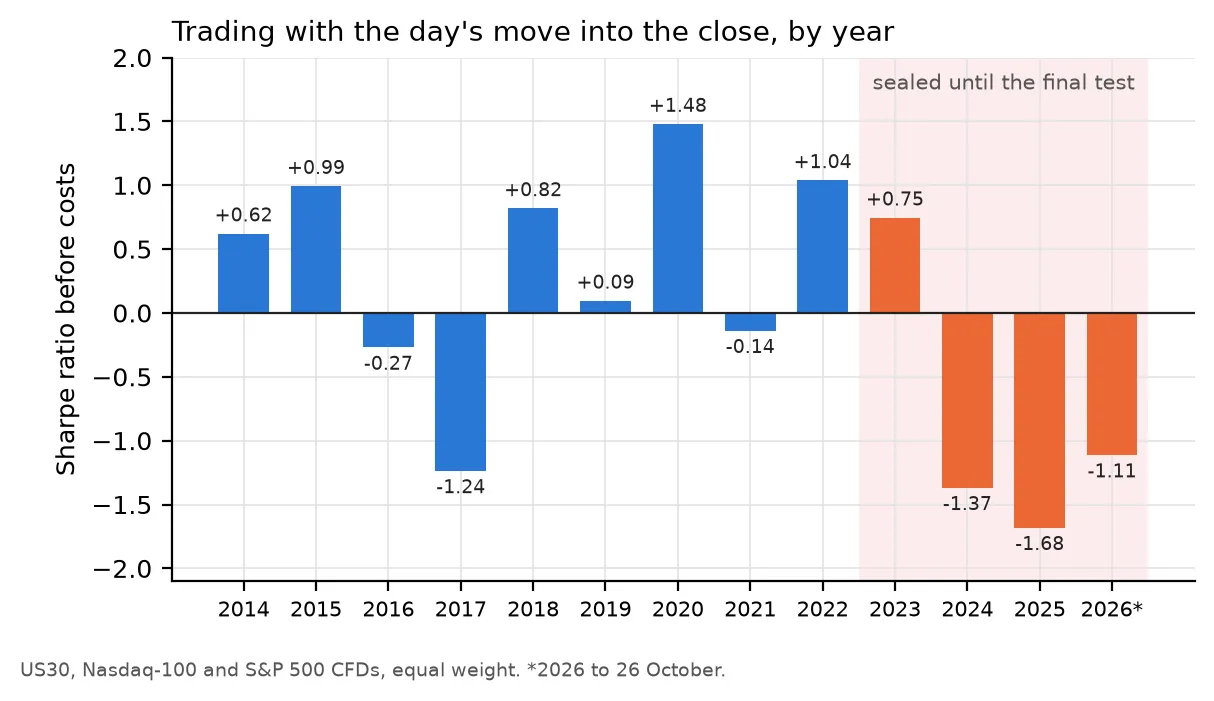
There was one more safeguard. I locked away all data from January 2023 onward and never looked at it while designing or testing anything. The deal I made with myself: an idea that passed all five tests would get to open the lockbox exactly once. A blind final exam, not another practice round.
Four ideas earned it. Here’s how they did:
| Hypothesis | Gauntlet Sharpe (2007–22) | Lockbox Sharpe (2023–26) |
|---|---|---|
| Cross-asset momentum/reversal (BTC, SPY, GLD, TLT) | +0.51 | −0.50 |
| Pairs trading, 7 same-industry stock pairs | +0.67 | −1.10 |
| Pre-FOMC announcement drift (SPY, QQQ) | +0.52 | −0.17 |
| Turn-of-month seasonality (SPY, QQQ) | +0.53 | +0.04 |
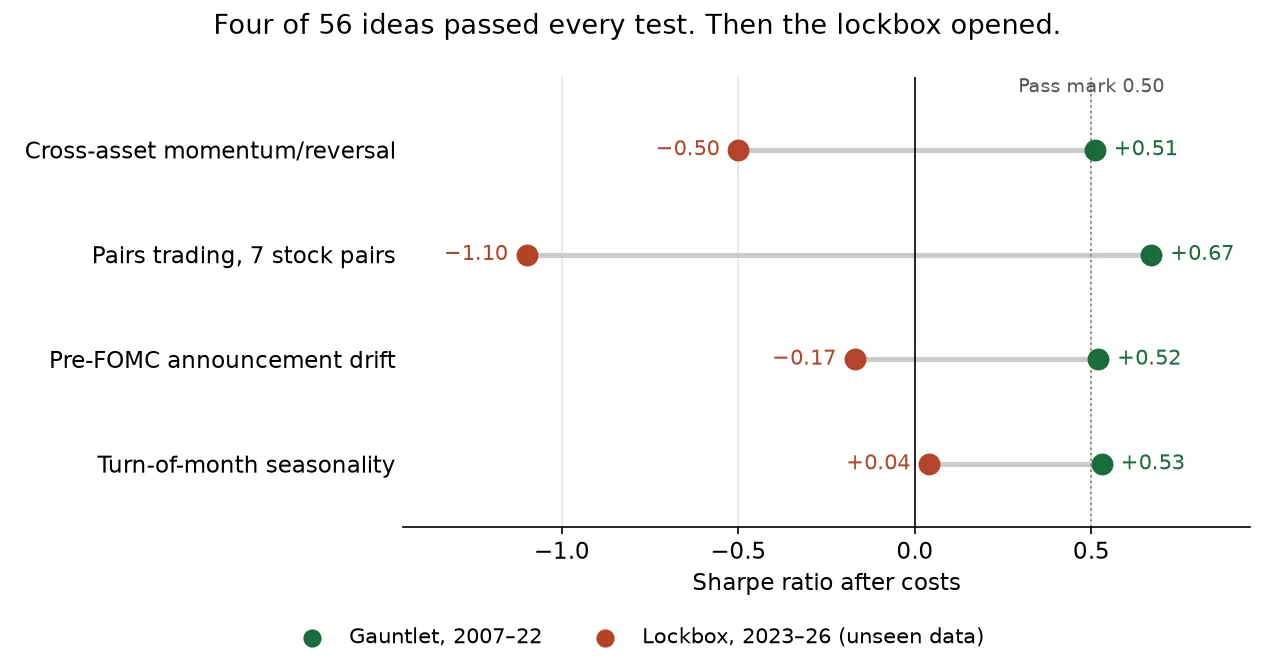
Three clear failures, and one result too close to zero to mean anything. I’d built this whole process specifically to stop me fooling myself, and it was wrong in all three cases where the answer was clear.
That doesn’t make the five tests useless. They threw out 52 of the 56 ideas before those ever got near the lockbox. But it taught me that “passed my tests” and “found something I could trade” are two different claims.
What made these failures useful is that none of them was bad luck. Each had a reason I could point to.
The cross-asset strategy learned from an unusually generous period. Its training years included the COVID crash, the sharp recovery and the 2022 interest-rate shock: perfect conditions for “buy what fell, and add some uncorrelated momentum”. The calm bull market of 2023–2025 had nothing like that. Digging into it turned up something worse. The strategy looked back 63 days at Bitcoin, which only catches the tail end of a crash, so it would bet against Bitcoin right as a multi-year bottom was forming. That’s not noise; it would happen again at every crypto cycle low.
I wrote and pre-registered a fix: a one-year lookback, closer to Bitcoin’s roughly four-year cycle. When I finally ran it, it was the best result that family of ideas ever produced (a Sharpe ratio of 0.70). It still failed, because by then I’d tried enough related versions that the penalty bar had risen to 0.73. So a sensible fix for a real problem will never get its lockbox exam. A frustrating place for an idea to end.
Choosing in advance doesn’t protect you from a changing world. I picked the seven stock pairs before testing, so this wasn’t cherry-picking. But three of them, Walmart/Target, UPS/FedEx and Caterpillar/Deere, turned out to be businesses drifting apart for good, not prices wobbling around a stable gap. A redesign with a stop-loss and a maximum holding time improved those three by 6–28 percentage points each, exactly as planned, and the portfolio still lost money (Sharpe −0.86). A new loser turned up in a pair nobody had worried about.
Knowing an effect is fading doesn’t tell you where it’ll land. This is the one I did almost everything right on. US stocks tend to rise the day before Fed announcements, a well-known finding (Lucca and Moench, 2015), and the research already said the effect had weakened after 2016. I compiled the Fed’s meeting dates by hand, one year at a time, set up a test to check the fade, and my data reproduced it almost exactly: a Sharpe ratio of 0.85 in 2011–2015 against 0.10 in 2016–2022. Then the lockbox came back at −0.17, below even the weak version I’d predicted. Understanding why something is weakening explained the shape of the failure. It didn’t stop it.
This was the mistake I didn’t see coming, and I only found it by going back and re-running ideas I’d already decided on.
Remember the penalty for trying too much? My system counted related attempts live, from the registry. So the very first idea in a new family paid no penalty at all. When I later added related ideas, the bar went up for every new one, but nothing ever went back and re-checked the first.
Two of my four “passes” were first in their families. I re-ran both with exactly the same rules and the same 2007–2022 data, and got the same results as before. But against the bar their families had grown into, both failed badly. The cross-asset strategy’s score fell from about 1.0 to 0.017; the pairs strategy’s to 0.386. Both needed 0.90.
In other words, two of my four “it passed!” moments wouldn’t happen if I proposed the same idea today. The market hadn’t changed. Only the size of my own search had. A “robust” label was only true until I tried a sibling. The fix is simple: re-check a family every time it grows. I just hadn’t been doing it.
The two safeguards catch different things. The penalty corrects for how many ideas I tried. The lockbox corrects for the world changing, which no amount of statistics on old data can see coming.
The ideas that never passed the five tests failed in three ways, and each one taught me something different:
The lockbox adds a fourth kind that the first three can’t catch by design: a real edge, an honest pass, and the wrong decade.
The strongest finding in the whole project isn’t a strategy at all. Index funds that had fallen most over the last three months tended to do better over the next three. As a predictor, it was strong (an information coefficient of +0.28 to +0.41, where academic stock signals typically manage 0.05 to 0.10), and it held up in every kind of market.
I never managed to turn it into money. Six different versions produced Sharpe ratios between 0.12 and 0.43. The problem is that US index funds move so closely together that seven of them act like five or six separate bets at most. Adding Bitcoin to spread the risk got one version through the five tests, and then the lockbox caught it anyway. Fixing the problem you can see doesn’t mean there isn’t another one hiding behind it.
If I started over tomorrow, I’d keep these:
Good economic reasoning, a clean pass on every test and agreement with published research can all line up, and a strategy can still fail the one exam it can’t game. What I have to show for this year isn’t a money machine. It’s a registry where every dead idea records what I tested, why, what I found, and what happened when it finally met data it had never seen. I think that’s worth more.