Nov 2026
Recording every new token forward, pre-registering every rule, and a real-money post-mortem that blamed the safety stops, not the strategy.
Quant, Research, Crypto, Python, Next.js
New to some of the terms? See the glossary at the end.
Dangote Cement, worth ₦25.1 trillion, is one of the largest companies on the Nigerian Exchange and a stock most local pension funds and asset managers have to have a view on. So it’s the obvious first company to write a proper research note on: the kind an analyst at a fund would hand their portfolio manager, with a rating, a price target and a model behind it.
I built everything from the company’s own filings on the NGX: five years of annual accounts, the 2025 and 2026 interim results and the earnings releases. A script pulls each figure out of the PDFs, tags it with the file and page it came from, and checks it against the next year’s filing, which reports the same year again as a comparison. That cross-check found three genuine restatements in FY2024 and nothing else. The valuation is a formula-driven Excel model, and a separate script recomputes it from the raw data without opening the workbook, as a check that the spreadsheet does what I think it does.
The short version: the business is in great shape, but at ₦1,490 the share price already assumes Nigerian interest rates will fall a long way. I rate it Underweight, with a 12-month target of ₦1,007.
| Share price (4 Nov 2026) | ₦1,490 |
| DCF fair value per share | ₦871 (−42%) |
| 12-month target price | ₦1,007 (−32%) |
| Market value | ₦25.1 trillion |
| Net cash (30 Sep 2026) | ₦51.1 billion |
| P/E, trailing 12 months | 20.0x |
| EV/EBITDA FY2026E | 10.4x |
| Dividend yield (FY2025 dividend of ₦45) | 3.0% |
Dangote Cement is Nigeria’s largest cement producer, with 55 million tonnes of capacity across Nigeria and ten other African markets. Nigeria brings in about two-thirds of revenue and 91% of segment operating profit (first nine months of 2026).
2025 was a pricing year. Nigerian volumes were flat at 17.7 million tonnes, but revenue per tonne in Nigeria rose 34.8%, from ₦124,000 to ₦167,200. Group EBITDA rose 43.4% to ₦1,981 billion, and the margin widened from 38.6% to 46.0%. Finance costs halved, from ₦700 billion to ₦352 billion, and profit for the year doubled to ₦1,015 billion.
2026 is a volume year too. In the first nine months, volumes rose 6.4% in Nigeria and 14.0% across the rest of Africa, helped by the new plant in Côte d’Ivoire. Group volumes were up 9.4%, revenue 19.6% and EBITDA 23.7%, with a 46.8% margin.

Revenue grew 32.8% a year from 2021 to 2025, mostly from price, as the naira fell and inflation ran high. Cash followed. Free cash flow reached ₦1,213 billion in 2025, three times the 2024 figure, and paid down most of the debt taken on in 2024. By 30 September 2026 the company had moved from ₦683 billion of net debt at end-2025 to ₦51 billion of net cash.
| ₦ billion | Cash from operations | Capex | Free cash flow | Dividends paid | Net debt at year end |
|---|---|---|---|---|---|
| FY2025 | 1,710.8 | 497.4 | 1,213.3 | 502.9 | 682.9 |
| FY2024 | 821.2 | 423.1 | 398.0 | 502.6 | 2,061.9 |
| FY2023 | 678.8 | 140.2 | 538.6 | 337.5 | 521.3 |
The stock is up 145% this year and trades at its 52-week high. On trailing earnings it is priced in line with the other listed cement makers, so it isn’t expensive against its peers:
| Company | Price (₦) | Trailing EPS (₦) | P/E |
|---|---|---|---|
| Dangote Cement | 1,490 | 74.41 | 20.0x |
| BUA Cement | 298 | 14.77 | 20.2x |
| HBM Nigeria (formerly Lafarge Africa) | 350 | 20.02 | 17.5x |
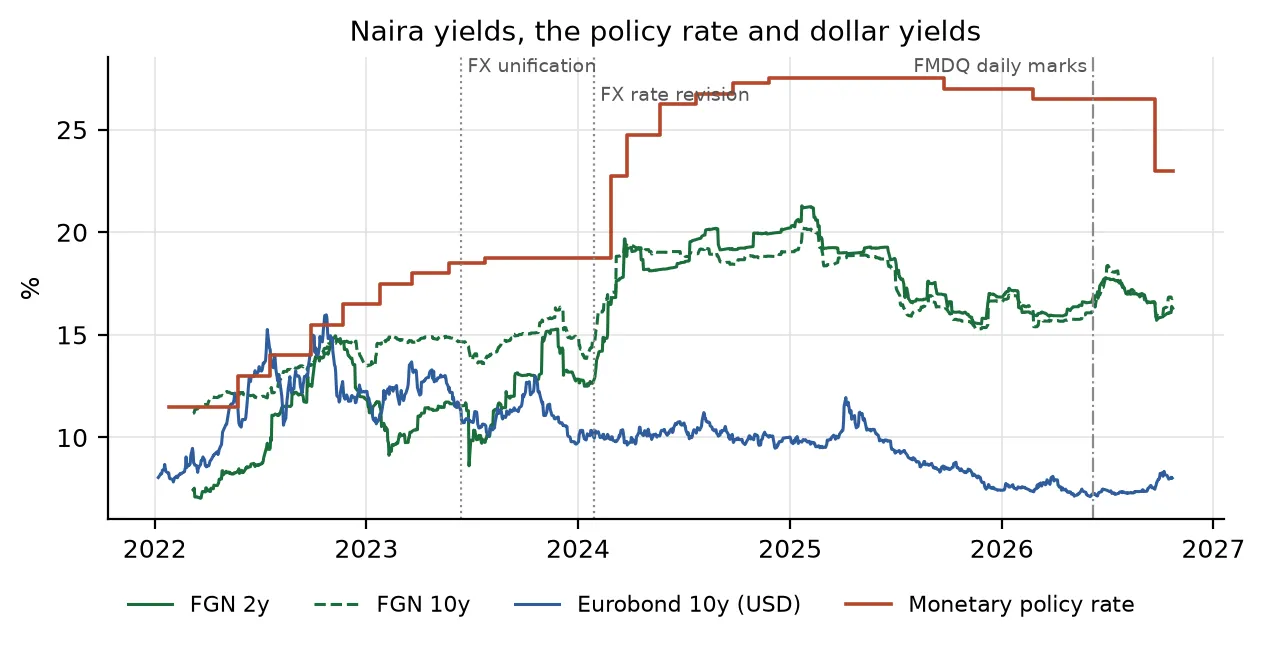
The problem is the comparison a Nigerian fund manager actually faces. Dangote’s free cash flow is 4.8% of its market value, and its dividend yield is 3.0%. Naira government bonds pay about 17%. Owning the shares instead of the bonds only makes sense if you expect interest rates to fall, a lot.
A DCF values the shares at ₦871. My forecast annualises the first nine months of 2026 (revenue ₦5,134 billion, EBITDA ₦2,450 billion for the year), then lets volumes grow 4–8% a year and naira prices 9–12%, roughly in line with inflation, out to 2031. The EBITDA margin eases from 46% to 44% as pricing normalises, and capital spending falls from 10% to 8% of revenue. Free cash flow to the firm rises from ₦1,341 billion in 2027 to ₦2,431 billion in 2031.
| Discount rate input | Value | Basis |
|---|---|---|
| Risk-free rate | 17.2% | Average rate at the DMO’s 19 October 2026 FGN bond auction (2034, 2036 and 2038 bonds) |
| Equity risk premium | 6.0% | My assumption |
| Beta | 0.90 | My assumption |
| Cost of equity | 22.6% | CAPM |
| WACC | 21.6% | 10% debt at 18.7% before tax, 33% tax rate |
| Terminal growth | 11.0% | About 8% long-run inflation plus 3% real growth, in naira |
The terminal value is 62% of the ₦14.8 trillion enterprise value, which is normal for a DCF and is why I care most about the two numbers that drive it. Here is fair value per share across a range of both:
| WACC \ growth | 9% | 10% | 11% | 12% | 13% |
|---|---|---|---|---|---|
| 19.6% | 923 | 989 | 1,071 | 1,174 | 1,309 |
| 20.6% | 844 | 896 | 960 | 1,039 | 1,139 |
| 21.6% | 777 | 820 | 871 | 932 | 1,008 |
| 22.6% | 720 | 755 | 797 | 846 | 905 |
| 23.6% | 671 | 701 | 735 | 775 | 822 |
Not one cell reaches ₦1,490. Rolling ₦871 forward a year at the cost of equity, less the expected dividend, gives the 12-month target of ₦1,007.
The more useful question is what you’d have to believe to pay ₦1,490. Running the model backwards, holding growth at 11%, the price implies a WACC of 17.1%, 442 basis points below mine. Both the cost of equity and the cost of debt are built on the bond yield, so that works out to a risk-free rate of about 12.6%, against 17.2% at the latest auction. In other words, the price assumes roughly 460 basis points of rate cuts that haven’t happened yet. The alternative, holding the discount rate and asking what growth the price needs, gives 16.4% a year in naira forever, above any realistic path for inflation.
Dangote Industries Limited (DIL) owns 86.65% of the shares, and Aliko Dangote, DIL’s ultimate owner, a further 0.17%. That leaves a free float of about 13%, which limits trading and how much of the stock a fund can build up.
The number that stood out in the accounts was a ₦1,045.6 billion loan from the group to DIL at the end of 2024, equal to 48% of the group’s net assets. It was gone by the end of 2025. In 2025 the group earned ₦68 billion of interest from DIL and paid DIL ₦47.3 billion of interest, plus a ₦14.0 billion management fee. It is all disclosed and audited by KPMG, but if lending to the parent on that scale comes back, I’d apply a governance discount to the valuation.
The equity risk premium, beta, terminal growth and forecast drivers are my own judgement, not market data. This is an independent analytical exercise, not investment advice. Prices and data are as of 4 November 2026.